3.1 |
Closure of units in the registered SSI sector has been a continuous feature. In the First Census of Registered SSIs conducted in 1973-74, it was found that 38.2 % of the units registered till 30th November 1973 was closed. In the Second Census of Registered SSIs conducted in 1990-91, 37.25 % of the units registered till 31st March 1988 was found to be closed.
|
3.2 |
In the Third Census also, the issue of closure was investigated. The units permanently registered till 31st March 2001 which did not operate even for a single day during the reference period 2001-02 were treated as closed, in the Census. For such units, information on year of closure was also collected. Reasons for closure were not elicited in the Census, as it would be difficult to locate the large number of the concerned entrepreneurs who would only be able to furnish the information. However, this question was canvassed in the recent Sample Survey of Registered SSIs conducted during 2000-01. It was found in this survey that the main reasons for closure were 'Marketing problem', 'Finance problem', and 'Could not survive competition'. These reasons would apply to the closed units identified in the Third Census as well.
|
3.3 |
Out of a total of 22, 62,401 permanently registered units surveyed in the registered SSI Sector, 8,87,427 units (39 %) were found closed in the Third Census. Of these, 3,36,492 units (38 %) were located in rural areas. With regard to the distribution of closed units over different States/ UTs, the States of Tamil Nadu (14.33 %), Uttar Pradesh (13.78 %), Punjab (9.32 %), Kerala (8.43 %), Madhya Pradesh (7.40 %) and Maharashtra (6.11 %) had the maximum number. These six States together accounted for 59.37 % of the closed units in the country. State/UT-wise details of the closed SSI units are as follows:
|
|
TABLE 10: DISTRIBUTION OF CLOSED UNITS, STATE-WISE &
LOCATION-WISE
|
|
S. No. |
Name of State/ UT |
No. of closed units |
Percentage to
Total |
| |
|
Rural |
Urban |
Total |
|
1. |
JAMMU & KASHMIR |
11288 |
11421 |
22709 |
2.56 |
2. |
HIMACHAL PRADESH |
4595 |
1914 |
6509 |
0.73 |
3. |
PUNJAB |
24385 |
58346 |
82731 |
9.32 |
4. |
CHANDIGARH |
52 |
1353 |
1405 |
0.16 |
5. |
UTTARANCHAL |
7012 |
5088 |
12100 |
1.36 |
6. |
HARYANA |
12454 |
15092 |
27546 |
3.10 |
7. |
DELHI |
189 |
8168 |
8357 |
0.94 |
8. |
RAJASTHAN |
12610 |
24237 |
36847 |
4.15 |
9. |
UTTAR PRADESH |
46378 |
75904 |
122282 |
13.78 |
10. |
BIHAR |
8330 |
12195 |
20525 |
2.31 |
11. |
SIKKIM |
65 |
90 |
155 |
0.02 |
12. |
ARUNACHAL PRADESH |
182 |
66 |
248 |
0.03 |
13. |
NAGALAND |
58 |
71 |
129 |
0.01 |
14. |
MANIPUR |
901 |
325 |
1226 |
0.14 |
15. |
MIZORAM |
194 |
1119 |
1313 |
0.15 |
16. |
TRIPURA |
387 |
690 |
1077 |
0.12 |
17. |
MEGHALAYA |
1166 |
742 |
1908 |
0.22 |
18. |
ASSAM |
4632 |
5706 |
10338 |
1.16 |
19. |
WEST BENGAL |
8467 |
17613 |
26080 |
2.94 |
20. |
JHARKHAND |
5604 |
8218 |
13822 |
1.56 |
21. |
ORISSA |
3530 |
6178 |
9708 |
1.09 |
22. |
CHHATTISGARH |
19831 |
7999 |
27830 |
3.14 |
23. |
MADHYA PRADESH |
36484 |
29165 |
65649 |
7.40 |
24. |
GUJARAT |
7627 |
31532 |
39159 |
4.41 |
25. |
DAMAN & DIU |
439 |
15 |
454 |
0.05 |
26. |
DADRA & NAGAR HAVELI |
205 |
218 |
423 |
0.05 |
27. |
MAHARASHTRA |
10265 |
43978 |
54243 |
6.11 |
28. |
ANDHRA PRADESH |
14730 |
23852 |
38582 |
4.35 |
29. |
KARNATAKA |
15608 |
31003 |
46611 |
5.25 |
30. |
GOA |
1379 |
948 |
2327 |
0.26 |
31. |
LAKSHADWEEP |
4 |
12 |
16 |
0.00 |
32. |
KERALA |
48013 |
26819 |
74832 |
8.43 |
33. |
TAMIL NADU |
28515 |
98670 |
127185 |
14.33 |
34. |
PONDICHERRY |
653 |
1933 |
2586 |
0.29 |
35. |
ANDAMAN & NICOBAR ISLANDS |
260 |
255 |
515 |
0.06 |
All India |
336492 |
550935 |
887427 |
100.00 |
|
3.4 |
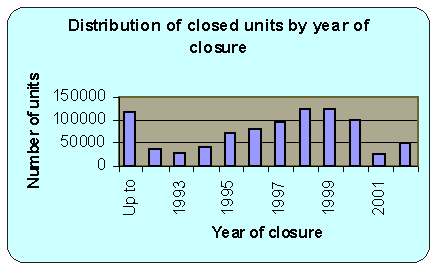
State-wise distribution of closed units by the year of closure is given in table R43 at the Appendix. It was found that maximum numbers of units were closed during the years 1998 and 1999. Percentage distribution of closed units by the year of closure at all India level is depicted in the chart and the table given below:
|
|
TABLE 11: DISTRIBUTION OF CLOSED UNITS BY THE YEAR OF CLOSURE
|
|
Year |
Up to 1991 |
1992 |
1993 |
1994 |
1995 |
1996 |
Percentage of closed units |
12.97 |
4.27 |
3.20 |
4.75 |
7.99 |
8.85 |
Year |
1997 |
1998 |
1999 |
2000 |
2001 |
Not recorded |
Percentage of closed units |
10.39 |
14.17 |
13.67 |
11.25 |
2.97 |
5.52 |
|
|

|